Hand grip span and L-T relationship
ISYE 348 Fall 2024 Lab 8
Author:
Date: 2024-11-04 00:00:00 +0000
This lab assignment is due by 23:59 on 2024-11-05. If you have any questions or need clarification, please reach out to me via email or during office hours. The report will be graded on 20 points based on the following criteria:
| Criteria | Points |
|---|---|
| Introduction (your own words; 50-100 words) | 1 |
| Methods (your own words; 100-200 words) | 1 |
| Results | 7 |
| Discussion | 6 |
| Improvements | 2 |
| Conclusion | 3 |
Submission: Please submit your report as a PDF file on Canvas. Make sure to include your name and your partner’s name at the beginning of the report. Include any code, plots, or tables as needed to support your answers. Make sure to answer all questions thoroughly and provide detailed explanations where necessary. Cite any external sources used. Submit one single pdf file with all the answers.
Collaboration with your classmates is encouraged, and you will work in pairs for this lab to complete the report. Please list your partner’s name at the beginning of the report. Only one submission per group is required. Must include data from both partners in the report.
Late submissions will be penalized by a 1 point deduction every hour past the deadline.
\[\text{score} = \max(20 - \lfloor \text{hours\_late} \rfloor, 0)\]Please read the course policy on academic integrity and collaboration on the course syllabus. If you have any questions about what is permissible, please ask before submitting your work.
\clearpage
1. Introduction
Hand grip span and strength are essential anthropometric measurements in ergonomics and human factors. The relationship between hand grip span and strength is crucial for designing products, tools, and interfaces that accommodate a wide range of users. This lab aims to explore the relationship between hand grip span and strength, considering factors such as age, weight, and height. Understanding the L-T (length-tension) relationship in hand grip exercises can provide insights into user capabilities and limitations in various tasks.
2. Objectives
- Measure hand grip span
- Demonstrate the L-T relationship for hand grip exercises
3. Materials
- Hand grip dynamometer (to measure grip strength)
- Ruler (to measure hand span)
4. Methods
- Data will be collected for all group members. Obtain their age, weight, and height.
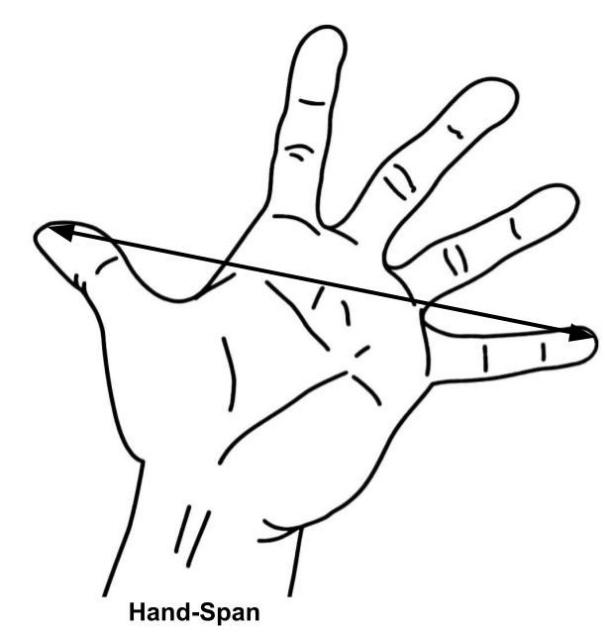
- Measure the hand span of each participant using a ruler. The hand span is the distance between the tip of the thumb and the tip of the little finger when the hand is fully extended.
- Volunteers should perform some warmup grip exercises of their right hand before beginning the grip measurements.
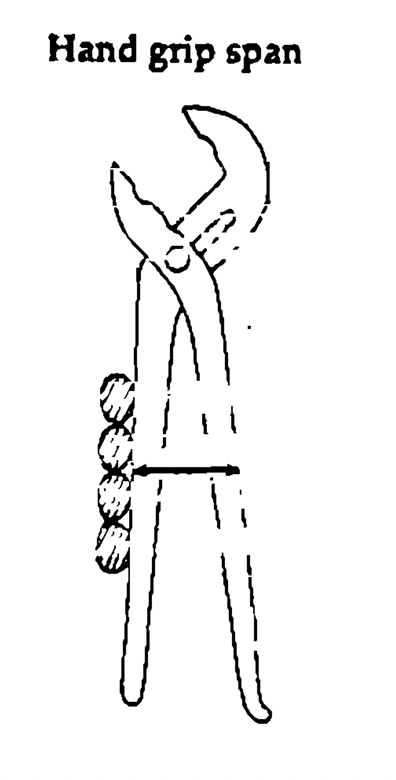
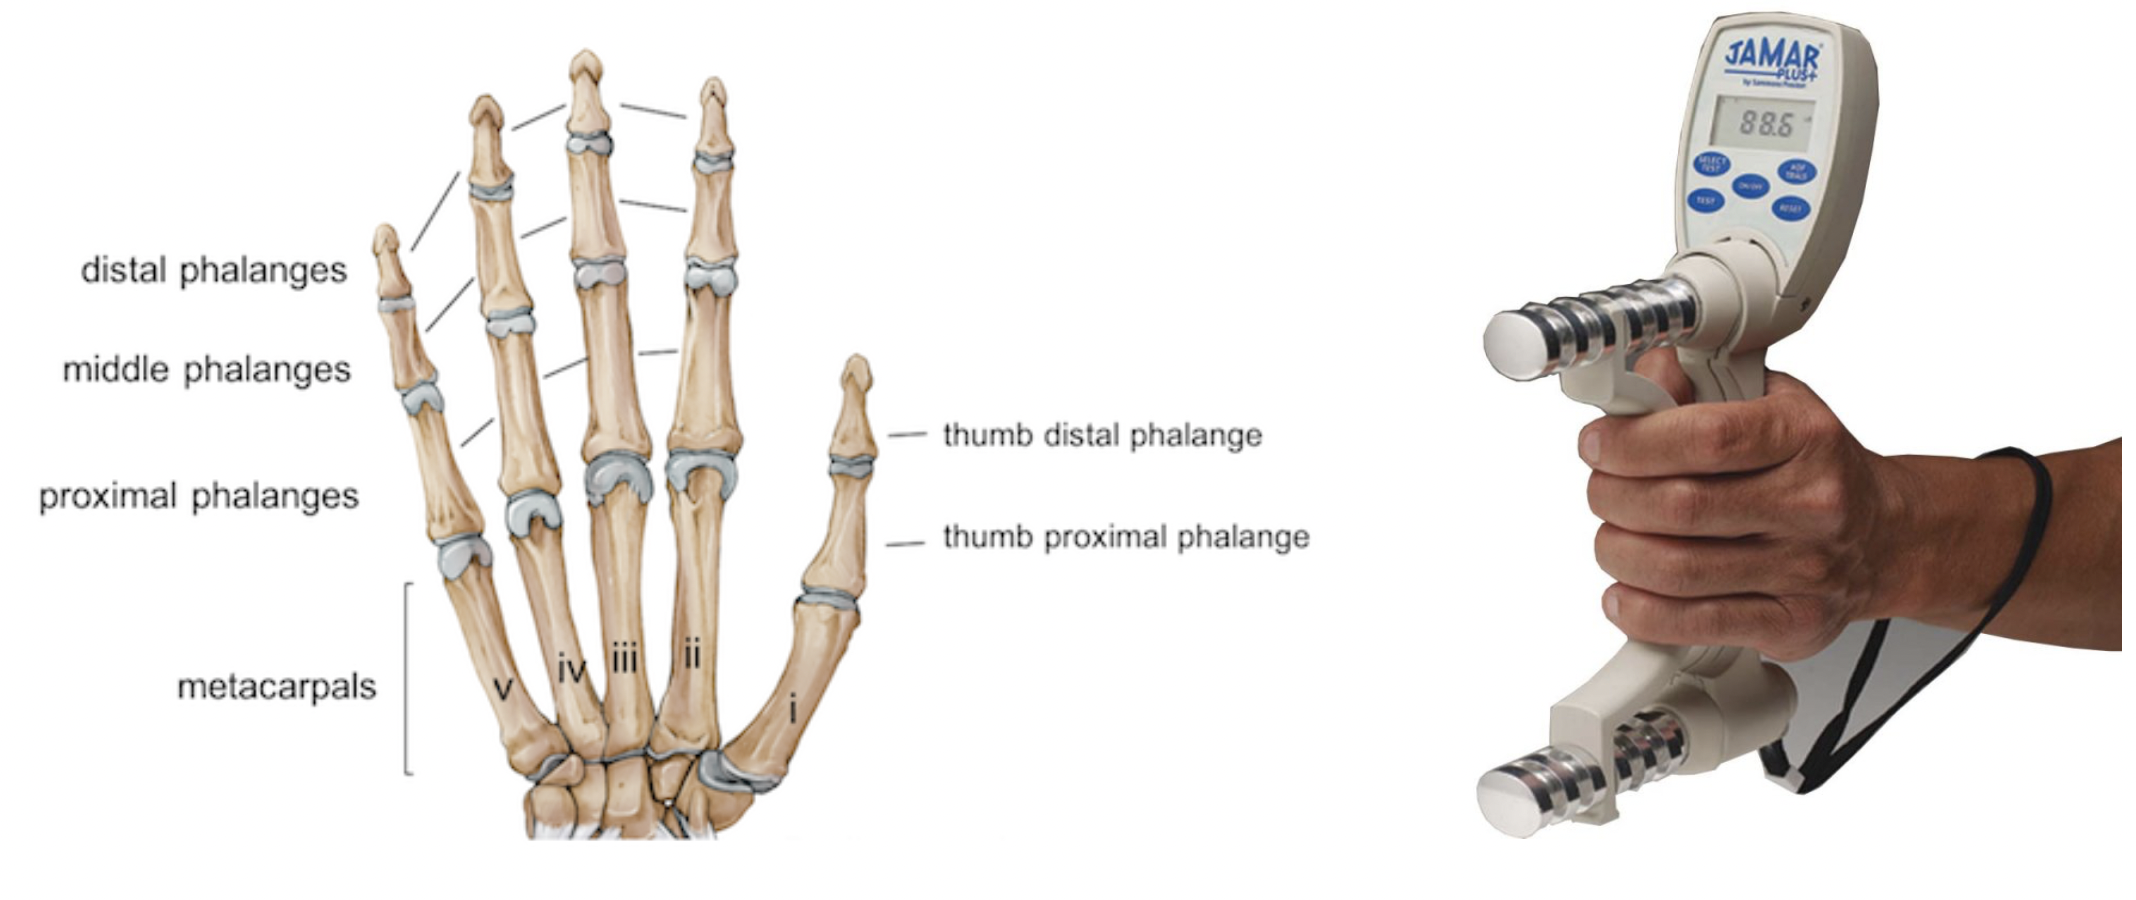
- Typically, the grip dynamometer is aligned so that the pressure bar is aligned with the metacarpal heads (knuckles). In this lab, the pressure bar will be aligned with 3 different positions (measure hand grip span at each position):
- At the distal phalangeal joint of the middle finger
- With the metacarpal head of the middle finger
- With the center of the palm. Keep your elbow at 90 degrees and wrist in the neutral position.
- Each volunteer will perform 2 strength trials at each of the 3 grip span lengths for a total of 6 trials. We will follow AIHA (https://www.aiha.org/) strength measurement procedure for static testing. Remember that you will need 2 min rest between each trial
- Randomize (or counterbalance) the order of the grip span lengths and provide adequate rest between each trial.
 { width=30% }
 { width=15% }
5. Results
5.1 Data Collection
Record all measurements in the table below. Use consistent units.
| Subject | Age (years) | Weight (kg) | Height (cm) | Hand span (cm) |
|---|---|---|---|---|
| 1 | ||||
| 2 | ||||
| … |
| Subject | Position | Hand Grip Span (cm) | Trial 1 | Trial 2 |
|---|---|---|---|---|
| 1 | Distal phalangeal | |||
| 1 | Metacarpal head | |||
| 1 | Center of palm | |||
| 2 | Center of palm | |||
| 2 | Distal phalangeal | |||
| 2 | Metacarpal head | |||
| … | … | … | … | … |
5.2 Class data
- For each condition, calculate average handgrip strength for each male and female participant
- Create a line graph showing the average handgrip strength (across all participants) in each condition ($X$: grip span, $Y$: handgrip strength). You should create separate lines for males and females in the same graph. Be sure to include Standard Deviation error bars (note that SD error bars need to be made using “custom” option in excel and not the default option OR use any programming language).
6. Discussion
- [2pt] How do the L-T relationships measured here compare from those we talked about in class? Why do they differ (if indeed they do)?
- [1pt] Describe any sex-differences between the L-T relationships.
- [2pt] Quantitatively compare your data to a published study from the literature. Discuss variances if any.
- [1pt] What sources of error do we have in our measurements, and how could they affect our results?
- [1pt] What are the potential limitations of this approach?
7. Improvements
Discuss any improvements or modifications that could enhance the accuracy and efficiency of the measurements. Consider the instruments used, measurement techniques, and data recording methods.
8. Conclusion
Summarize the importance of accurate hand grip span and strength measurements in human factors and ergonomics. Highlight the key takeaways on how these measurements can improve user experience in product design.